Now, I have covered the basics of Google Earth previously to show how to get it up and running and get basic feeds from sources that have pre-formatted them for you. Thus you can get real time data for earthquakes, volcanos, weather, the air traffic situation over the US and much, much more, available for free from various services. Basically Google Earth becomes a component-based system for getting geospatial information that is value-added and serves as a platform for such information.
Many organizations give out absolutely, positively free for use information, although some is only for 'personal use only' - which, in the mp3 world of music, means you and your coterie of friends. Some people have tens of thousands of 'friends'... seems a pretty expansive use of the word, but, be that as it may, do be warned of that.
But you, the intrepid GIS enabled Imagery INTEL Analyst will now be taking a step *forward* into the brave, new world of All Source Exploitation.
What does that mean?
It means that to get the proper context of events on the ground you are going to glom onto every piece of data about a region, locale, Nation or continent that you can get your grubby little mits on and put that into a Geospatial Context. And your platform of choice, as it has an Open Architecture for all sorts of goodies is: Google Earth.
Now a few of you may be remembering the lovely imagery of the Ray Nagin Katrina Bus Memorial that Google had in its Maps area. Well, those fine folks now integrate that imagery directly into Google Earth. Additionally, other people now run entire websites to add value to that via the web browser and then offer the feeds of that information into Google Earth.
I like to think of this as 'An Army of Imagery Analysts'. Mind you things like all the good restaurants will start to show up, and where the best places to stay are and some folks looking at favorite sports facilities and such. And you do, in actuality, WANT that information! It will help *you* figure out what is going on in any given location, and is beyond price in the INTEL community which requires HUMINT to get it. So, by putting down where the good theaters are and the Opera House and that part of the Airport you could never figure out what was going on with, you are adding to the value of mankind and helping those of us trying to figure out what is REALLY going on in that part of the airport. Plus, if we come to visit, we have a ready made list of places to stay and get decent eats from! Its a two-fer!
So here is a short list of some of those wonderful sites you can add in to start the ball rolling for yourself, descriptions taken from the source itself:
1) Geonames Database: Shows the 60 biggest cities in the field of vision. The source is www.geonames.org. This work is licensed under a Creative Commons Attribution 2.5 License. Google Earth-Version is from: Kolossos. The database has 142.000 entries. [Note: this is a network feed, but copying placemarks and such can be done in case you have to go offline. A german website but the Names are perfectly readable once they are up.]
2) Wikimapia: WikiMapia is an online map resource that combines Google Maps with a Wiki system, allowing users to add information (in the form of a note) to any location on the globe. Visit http://www.wikimapia.org/ for more details. [The user input is often sketchy with things like 'private building' showing up for entire neighborhoods. Again a live, network feed with linkback to Wikimapia in case you want to share your insights with the world.]
3) Google Earth Hacks: Five seconds after you stop moving the camera, this script will run out to GoogleEarthHacks.com and grab up to 50 files that can be seen in your current viewing area. [Note: a live network feed. This has all the wonderful weird things that people have seen in their browsing around the Globe. It is chock-a-block full of things like aircraft taking off, strange structures in the middle of absolute nowhere and people pointing out that some things are just not PUT onto maps. You have not had fun until you have seen farmers raising crops to spell out USA so that it is visible on imagery.]
4) Google Maps Overlay. [Note: live network feed. This is if you want to make a hybrid image/map with map data and imagery mixed to show detail and context.]
5) Semapedia.org. [Note: live network feed. Take picture phone and barcode scanner, throw in tags, geolocate pictures, put them up into a database with ability to stream out to Google Earth. Yes, you now have pictures taken by individuals on their cellphones available to YOU!]
6) UNESCO World Heritage sites: All 788 World Heritage Sites as of Oct 2004.
Descriptive snippets are quoted from: http://whc.unesco.org © 2003 UNESCO, United Nations Educational, Scientific and Cultural Organization. [Static listing of sites of interest around the world.]
7) Volcanoes of the World : Information courtesy of the Global Volcanism Program, Smithsonian Institution. [Static placemarks folder. Ever so handy for those learning the difference between volcanic/geological craters and bomb damage ones. The Smithsonian appears to be getting heavily into Google Earth, so expect that their current heritage downloads with Google Earth will be heavily supplemented and added to over the years.]
8) Weather Tools from Google Earth Blog: Collection of useful weather tools written about at Google Earth Blog. See the Weather Category for details on these tools:
- Hurricanes - Live positions
- Global Cloud Map
- NOAA Severe Weather
- Weather Bonk
- Real-Time Day and Night Earth
- European Lightning Strikes
- Annual Lightning Flash Rate
9) Earth Impact Structures - North America. [Static list. Provided by ThinkLemon.]
10) SEIS Impact database from ThinkLemon.[Another static list of large and small impact craters. Again, bomb damage folks should use this to realize differences between volcanic craters, impact craters and bomb craters.]
11) Avian flu H5N1 outbreaks in birds, and in humans. From Declan Butler. [Both live and static feeds available. GoogleEarth 4 is necessary for the live feeds.]
12) CounterTerrorism Blog: The first multi-expert blog dedicated solely to counterterrorism issues, serving as a gateway to the community for policymakers and serious researchers. Designed to provide realtime information about terrorism cases and policy developments. http://counterterrorismblog.org/[ Note: Live feed. What they have done is take their standard RSS feed, put it through the Geonames lookup and then PRESTO! it appears in GoogleEarth geolocated. Nifty, huh? Wish you could do that, too? Check out the geonames folks as it is a FREE SERVICE!]
13) And the #1 place for all of your end-user generated content is the Google Earth - Keyhole bulletin board. End users post the most info and it grows and grows and grows!
Now, once you have all of that information you can start doing other nifty stuff with it!
So lets start with something pretty easy. Lets say you wanted to pin down an archaeological dig site, but found that it is NOT in anything done by the Google Earth community and the folks at the university involved haven't had time to do a Google Earth rendition of their work. Now it is time to have some fun with Google Earth!
The site that interested me is the Tell Hamoukar site that the folks at the University of Chicago have been looking at. And their first 1999 report was so woebegone in map information that you could *not* place it on a map unless you were an expert in the field or a field expert that had been on the expedition. Woe betide the poor INTEL analyst!
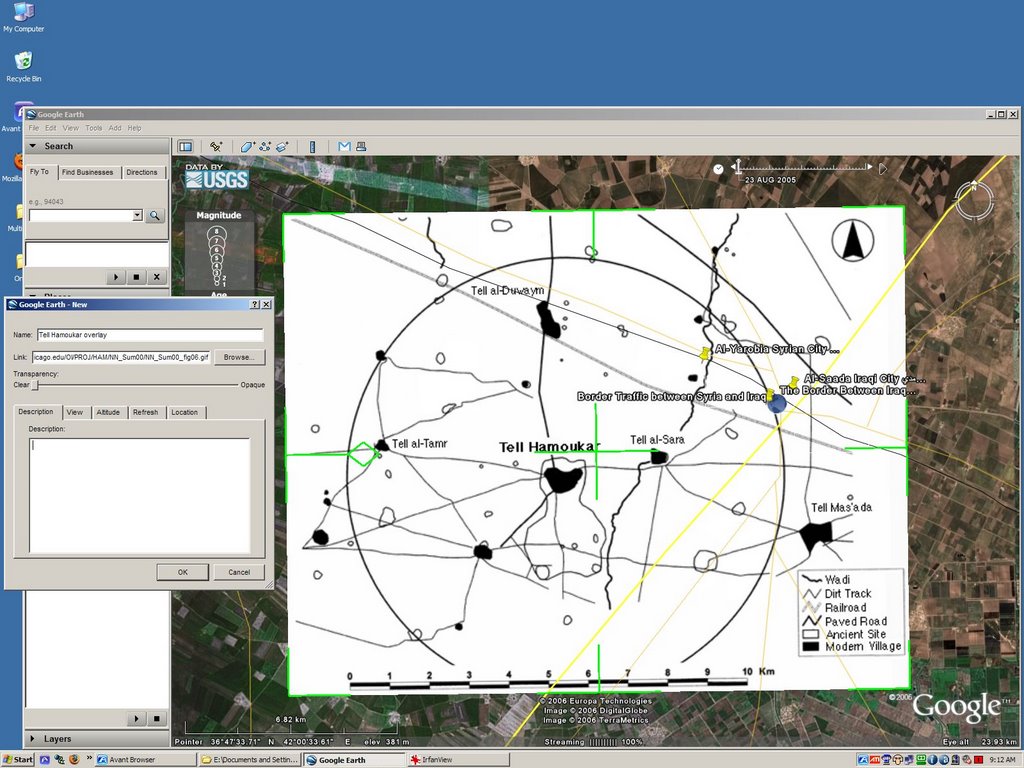
But is it really that bereft? Check out the one map they provide here that looks like this

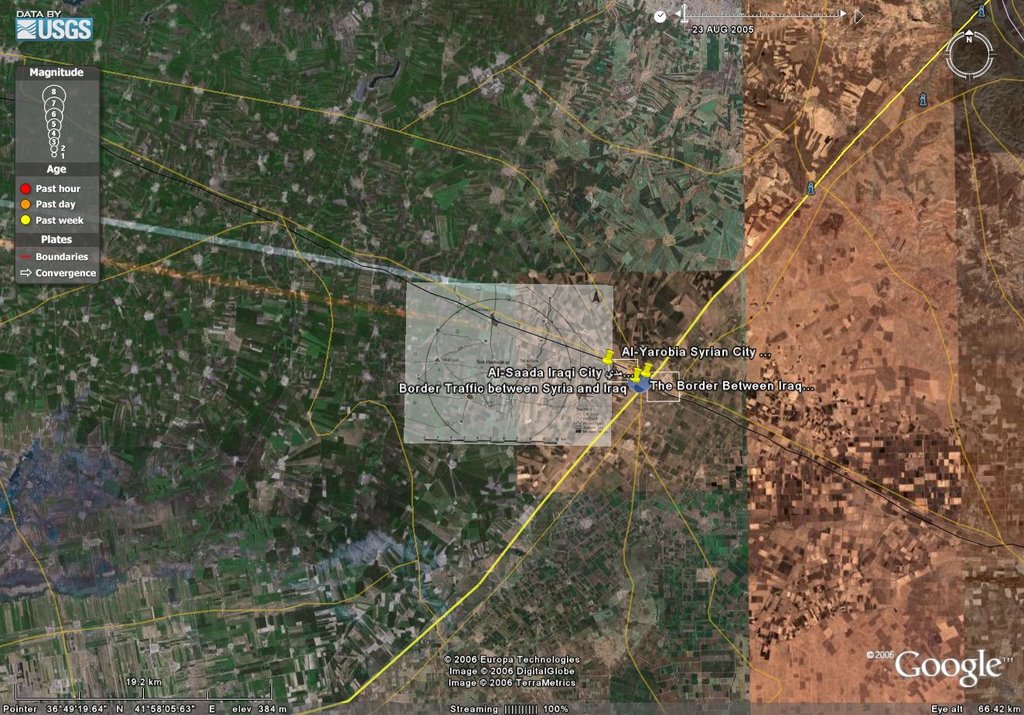
Why, its a key to the entire location! Now we are set! Using the information in that and the pervious general location map we can now start to find this actual place. So get in the general border region near the tri-border of Syria, Iraq and Turkey.
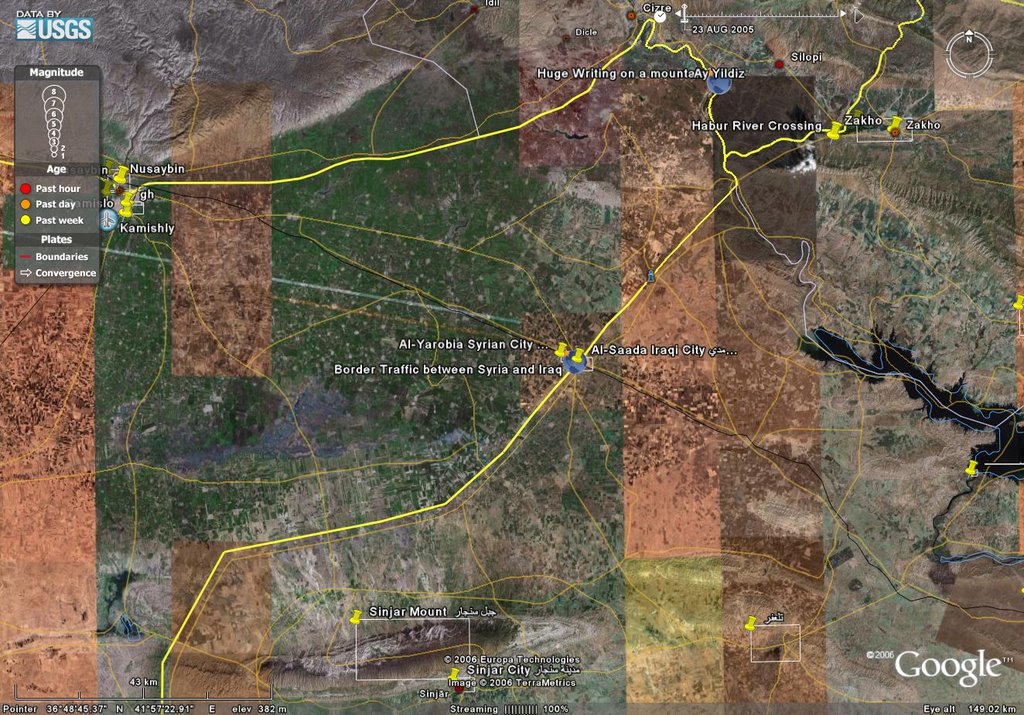
With a bit of zooming in the general area in question starts to come into view.
That, actually is starting to look like something! Now, here is something you need to be clued in on regarding the coloration of the imagery. Most of the Green is *not* on the ground green but is representative of different water content and reflectivity. We have two distinct data sets, one which says 'desert' on the right and the other indicating a rich grassland on the left. That is a difference in which part of the spectrum is being picked up, and here IR is probably being used and a lot of the higher spectrum is not on the left. The right is more what you could expect for tonality on the ground. But, that said, we can begin to see that there are certain points of similarity showing up.
Now, from my cartographic days, we will now invoke the 'rule of thumb for objects'. This is to get the heirarchy of what can be dependable for NOT changing over years or decades.
1) Mountains. They seem to stay in one place, unless you are looking at Japan, and then the evidence of moving a mountain is obvious.
2) Generally, rivers. Highly meandering rivers will change configuration over decades, but most rivers sit in their streambeds for centuries if not millenia. The Rio Grande is a sluggish course changer, and the Mississippi Delta reliably disintegrates so fast that it can't be mapped any more. But you can usually depend on a configuration to last more or less a lifetime.
3) Railroad beds. Even once a rail line is taken out, the hard and compact bed is usually left. Not worth the time and effort to take it out, especially if a road is to be built on it.
4) Roads. These do change in width and even in placement over time, but generally follow the same course.
5) Pipelines. Hard to make, hard to move, generally stays put for decades.
6) Shorelines. In generally, looking for Mean Sea Level, these do not change much over a decade or so, but they DO change rapidly.
7) Powerlines, fences, and anything else, like trees and urban outlines. Forests stay more or less in place, but logging can instantly change geospatial context in one season.
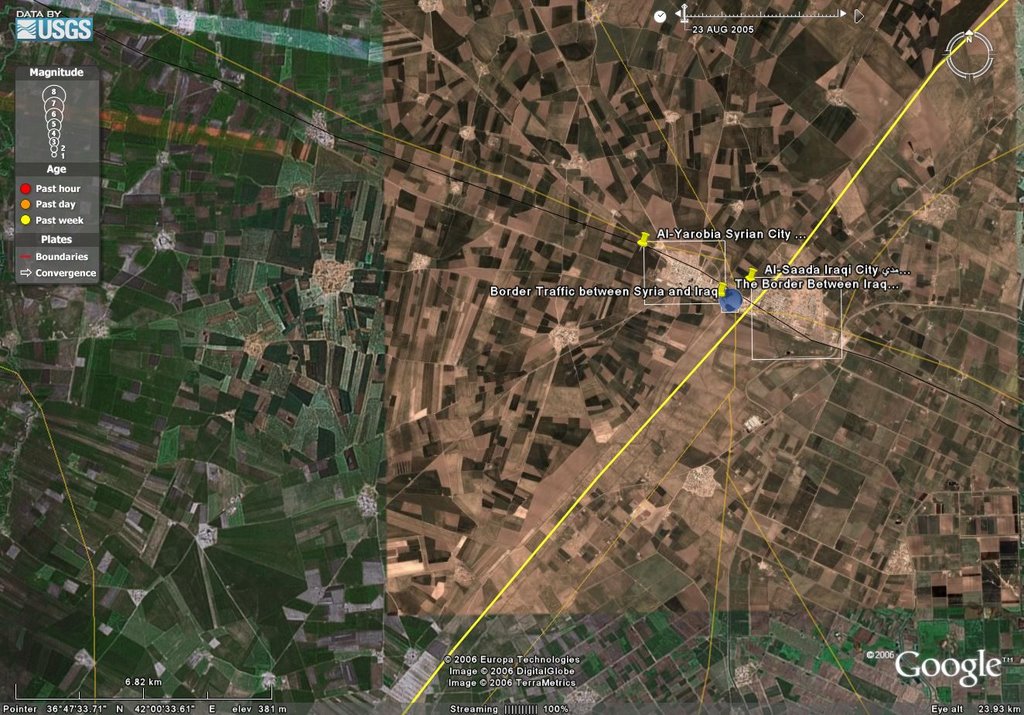
So the site location map doesn't have mountains, although major hills and mounts are on it. But what is that going through the upper mid-section? Yes, a RAIL LINE! So we look for a linear feature with a gentle curve in it and... why, yes, there is one! So we are in the right area, with a rail line now following a path that is described on a planning map and on imagery.
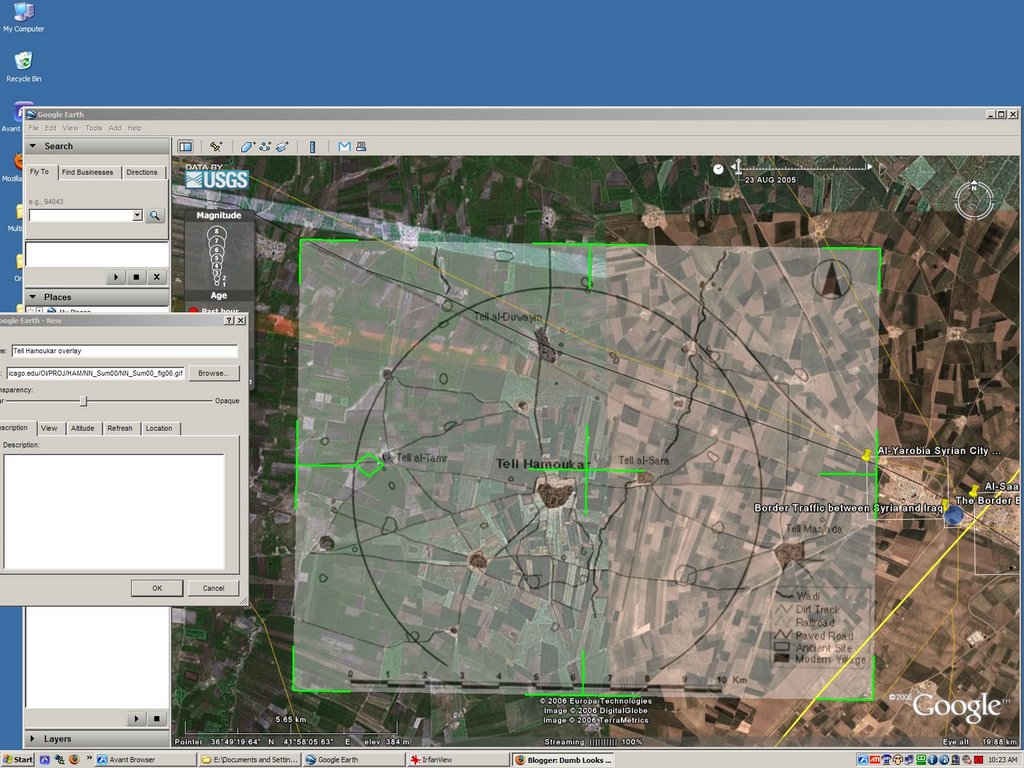
And now for the Magic of Google Earth. We are going to place the planning map IN Google Earth! Now for those of you not aware of this, you can get the properties of an image multiple ways, including viewing the source of the page of your web browser. The other for Windows is to do a right click, see the Properties, realize it is in a .jpg or .gif or .png or .bmp format and highlight that and Ctrl+C to copy it to your clipboard. That said I will give you the link to the University of Chicago planar view for easy copy and pasting: http://oi.uchicago.edu/OI/PROJ/HAM/NN_Sum00/NN_Sum00_fig06.gif [you may also want to copy the file to your hard drive and use *that* location... some places can update their websites and suddenly the images disapper... YMMV]
Now with that we will go to Google Earth and we will Add a Layer to it. It is a button up in the toolbar:
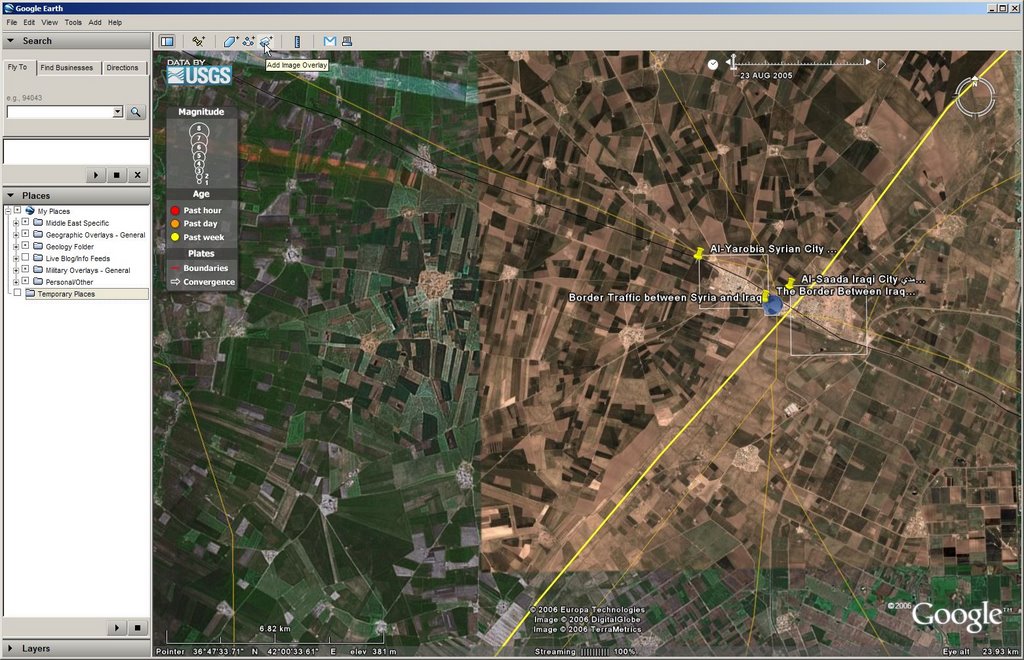


So, the obvious thing to do is to move the image over and adjust it so the curve of the rail line fits. That is to grab the center drag and then rotate until things line up a bit better. One thing we do have to note through all of this, is that since everyone is working from different imagery, map bases, resolutions and the such, there is no way to get a 100% match as all items depicted either in imagery or on a map have error to their positioning. GPS is helping on that, but it will be a few decades before everything is GPS depicted for maps, charts and images.
As this will move the image overlay up, we can still grab on the background so as to recenter the entire view of things. I will change the opacity a bit and the fit looks pretty good, but the scales are obviously way off.


I will leave putting placemarks and such up to the able student.
Mind you, once you get skilled at this, the entire procedure takes about 10 minutes, often far less.
But with this single overlay I have defined an area that it is very, very, very unlikely to find the Nuclear Research group put together by Iran and Syria, using Iraqi and ex-Russian Republic nuclear scientists.
A fun site for lots of other imagery and analysis products, free for personal use is GlobalSecurity.org. Yes, in no time at all you will be fitting in military and other installations into your very own Google Earth and determining just what is going on in the neighborhood of the planet you are looking at.
Again, welcome to the world of being an INTEL Analyst! Deciding what it all means is where the 'intelligence' part comes in.
Yours.
Have fun!


 Supporting Friends and Allies


2 comments:
11 26 06
Thanks for this link AND information AJ. You are grrrrrreat! My husband will love this even better than the first post you did!
Mahndisa - My thanks!
I am amazed at how easy the folks at Google have made the tools that in yesteryear would have taken the better part of a day to get to this point... plus ALL the information that people make available!
I hope you can pry your husband away from the computer once he starts getting into this. And Google Earth is in Linux, too, so no excuse for dawdling.
Post a Comment