In science one of the things that folks try to do in experiments is to figure out ways to reduce the impact of random variables. This sounds easy, but it is a very tricky endeavor as something that you may think of as fixed or being non-deterministic or static, may turn out to be an independent variable that will influence what you are measuring. The most famous of these is the gravity experiment which has an independent variable on Earth's surface called: atmosphere. When dropping something in an atmosphere there is a problem with mass to surface area ratios, that change findings apparently at random... soon you are trying to find out why two objects of the *same* mass don't fall at the same rate and looking at surface are and learning about dandelion seeds, maple seeds, and having to make things like lift and drag coefficients and account for friction... in no time at all you have forgotten about gravity and invented all sorts of wonderful ways to model the average air speed of a sparrow.
Those little extras prove very handy in understanding the world around you and soon it dawns upon you that yes! atmosphere is a problem. Ways to remove it as a variable include removing lift and drag out from the air via things like inclined planes and seeing if there is any way you can easily get all of the air out of an enclosure. You learn much about friction, air pressure and the tensile strength of materials.... and how to seal leaks. Friction, luckily, stays relatively the same for certain surface type interactions, can be categorized, measured and you can start measuring gravity! While mankind would, actually, also create the vacuum pump, good air seals and the pressurized hair spray, we would also put on demonstrations of things in a vacuum falling at the same rate. Of course stepping onto a surface without any atmosphere to worry about would take a bit:
The Apollo 15 Mission Commander David Scott would do a service to mankind and create a headache for conspiracy theorists everywhere. Of course evidence of the astronauts walking around demonstrated a lack of atmosphere: in walking around they would kick up lunar dust. It would fall back to the surface at a measurable speed that was pretty much beyond the SFX folks of the day.
Still, if you did *all* possible controlled experiments on Earth you would slowly shift to an average value of gravity. Initial values might be too *high* but that is the nature of first controlled experiments of a given type: you don't know what can happen and measurements can be off by quite a bit. And then you correct everything you can think of and the measurement drops far below expectations. This is an effect that takes place outside of science and is often known as the 'Rookie Year Effect' in sports. Given that each individual player in a given sport has their own subtle difference, when they become part of an established setting, they outperform: no one knows how to react to them until mid-season.
Rookies, having a great start, then do not vary their play and soon find themselves in a 'slump' as a sophomore. Part of the art of professional athletics of any sort is to vary your play and keep your opponents off-balance. In martial arts, this is known as 'not doing the same thing over and over': mix it up, don't do the same set moves all the time, understand your strengths and weaknesses and take advantage of openings. After a large number of professional matches, which your opponents have been studying, your ability to adapt in the ring/octagon comes to the forefront and you are now managing your own style. Professional team players do this, also, and those that post year-on-year solid performances are now performing to their mean as a professional player. One year measurements, given everything else being equal, are not true measurements of the mean or average ability demonstrated in a given milieu.
Or, at least that is the 'theory', which is nothing more than an observation of "star" rookies.
But just how true is this phenomena? In the media driven age we come to expect a lot out of highly drafted rookies and the spotlight of the media adds its own problems. So lets take a look at a few players to get an idea of how regression towards the mean shows up over careers. In baseball the slugging percentage is the sum total number of bases divided by the at-bats, with a single counting as 1 x bases, a double as 2 x bases, etc. and that at-bats as the number of times an individual is up as a hitter. If a player could get a home-run every time at-bat, they would have a perfect score of 4.000. Note that walks are excluded from the statistics.
Here is how that looks for a relatively well known player:

Source: Fan Graphs
A decade further on and we take another well known player's slugging percentage:

Source: Fan Graphs
Here the MLB slope is pronounced as compared to the previous graph, also that the percentage scale has been somewhat compressed to pull in the higher top number range. Here, again, the 'rookie jinx' of outperforming the opening year and then falling badly off the following is not seen for this statistic. This player started off very well and then saw a slow decline in slugging ability over his career, which was a long one. Also notice the two spikes that show up in the graph and that they demonstrate regression towards the mean in the following year.
Regression to the mean in sports usually indicates a random event or events causing either an unusual peak or valley in play, and it is rare that an individual can actually reach that 'higher level' of play.
Oh, the players? Reggie Jackson and Cal Ripken.
This phenomena is something that happens across fields and, as a concept, is as applicable to econmics, say, as it is to slugging percentages or the average size of seeds from siblings as compared to the parent stock if no other selection basis is used. Only if there are structural changes or selectivity against certain trends do we then see a changing in the mean, which then changes performance evaluation. As seen in baseball that slugging percentage has been on the rise for decades and, apparently, indicates a concentration on learning how to hit the ball and hit it so that bases can be gained.
Economies are similarly interesting as they represent an ongoing function of society and, thus, will reflect the trends of it. Take Haiti, which has suffered decades of structural problems and internal strife and conflict since the Nation was formed. While not having a long term statistical series, even a shorter one can see that this economy has had a period of stagnation that has lasted for some time:

Source: Indexmundi
A quick look at another trend gives us insight into how a deviation from the mean can be seen in another graph:

Source: Indexmundi
Part of my overall view of things is to take this sort of factoring into account. When there is stability in a system, it tends to have a mean (even if it is a derived one, like continued economic expansion at a given rate) that takes external factors to vary it greatly. Even then the regression to the mean is a powerful force that does not make itself known directly and is difficult to control in a running system. It takes a lot to change a system that is running well. For all the labor relations problems in MLB, the slugging percentage still tends to go up every year. Such an external factor influencing things can be seen in the following:

Source: Indexmundi
Yet the underlying strength of the economy shows up after those random factors had played out: economic growth returned to the mean and has been, steadfastly, bumping along that mean growth rate ever since. That is not what we hear in the media, which cites other factors like unemployment, the cost of a barrel of oil or pointing to bad investment in the form of $1 trillion in sub-prime loans in the private residential sector. From 2001 the lesson is clear: the US economy can take far in excess of a $1 trillion loss in a single year, and most likely near double that due to the crashing tech sector, and not even reach into negative economic growth. Put that over 2-5 years, which is the rate that those taking sub-prime loans will take to wash through the economy, and you get a near non-event with, at worse, a 1-2% drop in GDP growth over that period per year. Actually, if we have learned anything from 9/11, it is far better to take the hit all at once, than to spread it out: the ability of the economy to rebound to the mean is extremely powerful and putting a structural problem in over a number of years may have a deleterious effect in the longer haul. Do it all at once and handle it, and the economy bounces back; spread it out and you may cause worse problems for the long haul.
That may seem counter-intuitive, but the US has demonstrated this capability *and* needing to rev up for a war in Afghanistan at the same time, along with the tech bubble bursting and the huge loss of infrastructure not only from 9/11 but numerous companies going under. Sub-prime loans, restricted to poor loan products by lenders and taken up by unwise individuals to get more than they can afford will not see: a loss in jobs, two large holes in the ground in the center of NYC, a foreign war starting up, or an entire part of the economy's technical infrastructure going through a recession. Those people holding such loans will still have a source of income, absolutely awful lenders will get pushed to the side-lines and possibly out of business, and those wise institutions will reap the benefit of becoming known as solid lenders and reputable for not trying to entice individuals into debt they cannot afford. As very little industrial or commercial capacity will be hit by the sub-prime lending problem, the actual ability to grow while such a problem hits the economy is undisputed given recent US history when those very fundamental parts of the economy were the ones taking the direct attack internally and externally.
And then there are recovering economies, like that of Iraq:

Source: Indexmundi
Here is the Iraqi GDP real growth rate:

Source: Indexmundi
If an insurgency is going to have a negative effect, it must sustain its ability to threaten and suppress the economy so as to inflict economic hardship on the population. The slew of infrastructure attacks from 2004-05 did that, but by 2006 the economy had begun to rebound from those losses. Obviously something else was going on, and that is told here:

Source: Indexmundi

This is one of the hardest lessons to learn about Counter-Insurgency work: if the people are not driven into despair in one of these three major areas due to violence, being deprived of basic services, or through some form of genocide you do not have much of an insurgency going. You soon go from glorified insurgent to a Royal Pain in the Ass that actually *can* be removed. An insurgency must cause a deviation from the mean that is long-term and disheartening enough to drive people to some form of radical solution. Usually that is how revolutions form: when government so ill meets the needs of the people of a Nation that the people just turn on the government and remove it as that is better than doing *nothing*. If you are very, very, very lucky and you have a generally well educated population used to civil culture, and that has not been under a reign of terror for a few decades, you will get a Philippine type 'People Power' movement. That is generally not the case in history as tyrannical regimes prefer populations to be on the uneducated side or so indoctrinated in the belief that they tyranny is 'good' that it will take a lot of abuse to dissuade them of that.
I have been saying for well over a year and going on two that Iraq is not going to hell because of the trendlines. These three, key items have been rock solid which points to an internal outlook of Iraq that is longer-term even into the Saddam era. For all the brutality, viciousness, corruption and just plain killing of Iraqis by Saddam, these trend lines did not change - the Iraqis were willing to put up with a lot so long as they got minimal services. The question was: would the breaking of the minimal services throw the Iraqi people into a revolutionary form of society attacking every-which-way and splintering the place? By SEP 2006 and the turning of Anbar on al Qaeda that answer was plain: NO.
By the end of 2006 each of these trend lines had shown evidence of shifting to a new mean: GDP Actual, Growth Rate and Per Capita. The underlying foundation of the Iraqi civil society that sustained the ongoing trend lines in death rate, life expectancy and infant mortality had withstood the shock of the insurgency and was showing signs of turning on it. 'The surge' was meant to drive out the worse external actors, clear out their internal supporters and start giving native Iraqi Army and Police room to entrench themselves within their society. The flow back of refugees is happening in those ethnically mixed neighborhoods because their neighbors *want them back*. There will be a residual that will not want to return: killers, supporters of AQI/JaM/Badr organization/criminal networks/Iranian Qods force, Ba'athists when not picked up by the former two categories, and those just wanting to start a new life somewhere else. Looking at those societal trendlines and their stability over time, my guess is that last will be a minority, but that is only a guess.
Now for a bit of graph analysis given equal time distribution! More fun than a body can handle this 'graph analysis' business...
Each of these graphs will be following an internal measured time that is equal along the Y-axis (with the numbers) and an equal spacing X-axis that I will keep unlabeled for now. These are all direct measurement graphs, not of derived figures, so it is something varying over time for each graph.

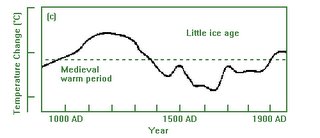
Here, between the interval of 900 to 2000 we see a recording with a mean line put in, so that one knows what the overall average is of the entire graph. Sort of like the Iraqi GDP per capita, isn't it? Especially from 1200 to 2000, you get something vaguely resembling it, although the recovery period doesn't outdo that 1200 period.
Perhaps a bit more like the US GDP Real Growth rate with a sudden drop off and recovery that never does get up to the previous growth rate? Maybe more like Reggie Jackson's 1972-'77 period, with that slump and then recovery, but not up to pre-slump slugging average. In any event you get the feeling that there is some regression to the mean, but with somewhat wide swings on either side of it, but never going outside of a limited range.
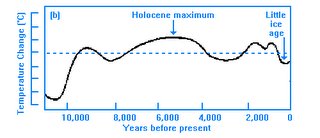
The next graph is also interesting in that regard:

Some feel of the Haiti GDP or US GDP Real Growth Rate here, also, with a steep decline leading to a pretty flat recovery with minor ups and downs. There is a strong pull to that mean line through the graph, especially after that 'rookie' time entry.
This next one is more problematical, however, as the mean line obviously doesn't have any real impact on the measurement:

The next two represent two different measurements taken during time intervals as seen on the Y-axis going from 0 to 60, but each measures something different. Both are at the same place and the same time.

Luckily this is not measuring that, so there is little problem there. But whatever it *is* measuring sure had a wide deviation from the mean slope and only recovered somewhat and then went down with the general slope again heading towards 0 on the X-axis.
Then there is the last one to consider:

And as these last two are co-measured, of different things at the same place at the same time, we should expect to see some correlation. There are some, but only on downward slopes where the top graph leads the bottom: around 12-15 and 20-30. But it looks like the bottom one leads the top in a few areas: 15-18, 33-34, and that spike around 36. So there are weak correlations, but nothing that I would pin as definitive, with sometimes the first leading the second and just as often the second the first.
Well, there you go having some fun with regression towards the mean... what?
What are those last series of graphs? I originally featured those in this post, and did a bit of photoshop work to remove original axis labels and such so that a feel could be had on just how graph reading and interpretation could help distinguish between strong and weak correlations on data. The last two I decompiled from a larger graph where they were put together, and I pulled them apart to better examine them... most folks have a problem doing that, so removing all sorts of extraneous information allows the data to show clearly through. Still, it was down and dirty photoshop work.
So I will now put them up so you don't have to go wandering back to that previous post:
 Courtesy of our friends at NASA.
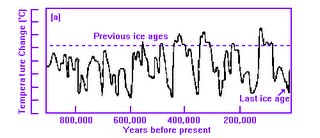 Again from the folks at NASA.
  Courtesy of Geocraft.com.
Yes, that last one is the compiled graph with the 0-8 first one being in 1,000 of ppm of carbon dioxide in the atmosphere and the lower one being mean global temperature by adding 12 degrees Celsius to the X-axis.
Notice the examined results leading to the conclusion that there is, at best, a weak correlation between global temps and carbon dioxide?
The graphs do not lie.
Apparently those in the global warming religion do. Or they don't know how to read a graph...


 Supporting Friends and Allies


No comments:
Post a Comment